DENIS: Difference between revisions
m (+cat) |
No edit summary |
||
| Line 1: | Line 1: | ||
{{Equipment}} | |||
[[Image:PieChartEN90.png|right|thumb|160px|Animations by DENIS]] | [[Image:PieChartEN90.png|right|thumb|160px|Animations by DENIS]] | ||
[[Image:BarChartEN90.png|right|thumb|160px|Typical bar chart from EN90]] | [[Image:BarChartEN90.png|right|thumb|160px|Typical bar chart from EN90]] | ||
| Line 7: | Line 9: | ||
[[Image:DenisMenu.png|left|thumb|160px|Main system menu]] | [[Image:DenisMenu.png|left|thumb|160px|Main system menu]] | ||
It featured a menu driven interface which launched a number of smaller programs, mainly because any colour graphics consumed over 60% of the BBC Micro's memory leaving very little room for software to generate it. It was conceptually split into editor/display/administrator, with final output including animated bar charts and pie charts. | It featured a menu driven interface which launched a number of smaller programs, mainly because any colour graphics consumed over 60% of the BBC Micro's memory leaving very little room for software to generate it. It was conceptually split into editor/display/administrator, with final output including animated bar charts and pie charts. | ||
Latest revision as of 17:40, 7 August 2019
- This article is about a piece of equipment. For more information on what it is for or how to use it, try its documents wiki article.
DENIS stands for 'Dynamic erroring and narking information system', and for a number of years was the brains behind the YUSU elections coverage on screen graphics until it was superceded by the higher resolution and colour depth Commodore Amiga.
Originally conceived in 1987 by Simon Barton, it was later revised in 1994 by Chris Kwouk, and unusually for YSTV home grown software included detailed program design notes - some 50,000 characters worth.
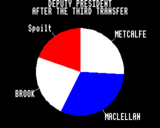
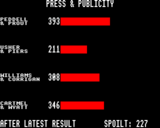
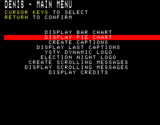
It featured a menu driven interface which launched a number of smaller programs, mainly because any colour graphics consumed over 60% of the BBC Micro's memory leaving very little room for software to generate it. It was conceptually split into editor/display/administrator, with final output including animated bar charts and pie charts.


